Project Analytics are good now
Get deeper insights into how people are using your projects with breakdowns, filtering, and more!
Posted on May 29, 2026 Modrinth Team
Hey everyone!
It's been over two years since we initially launched analytics for creators, and in that time we have gotten many requests from creators in the community to be able to see more data about their projects.
I’m excited to share a complete overhaul to project analytics.
With a new query builder and a lot of new data, you can finally dig into how people are playing your content.
TL;DR
- New advanced query builder
- Breakdown and filter by tons of different metrics
- Playtime metrics
- Line, area, and bar chart views
- Table view
- Event markers for project releases and Modrinth outages
Explore your data
To kick things off, let’s talk about the new query builder. At the top of the analytics dashboard, you’ll find a set of controls that lets you ask questions about your projects. You can select projects, choose a timeframe, and add breakdowns and filters to explore exactly the data you want.
Selecting projects
The first step is to choose the projects you want to look at. You can select projects you own, along with projects you’re associated with through organizations.
When not viewing analytics from a project, the page defaults to selecting all projects and breaking down by project.
Timeframes + interval
Next, select a timeframe and group results by an interval. We’ve added several timeframe presets like “Last 30 Days”, along with a custom date range picker. The intervals you can group by are based on the timeframe.
Breakdowns + filters
Lastly, the meat and potatoes: breakdowns and filters. Breakdowns split your data into groups to compare. Filters narrow the data down to only what you want to see. You can select up to two breakdowns and as many filters as you want. The following breakdowns and filters are available:
- Project — Only available when more than one project is selected
- Country
- Monetization — Shows whether downloads or views are monetized or unmonetized
- Download source — Shows what launchers your downloads are coming from
- Download reason — Shows if your project was downloaded as part of a modpack, dependency, or standalone.
- Project version
- Loader — Shows what loaders people are downloading your project for
- Game version — Shows what game versions people are downloading your project for
Metrics overview
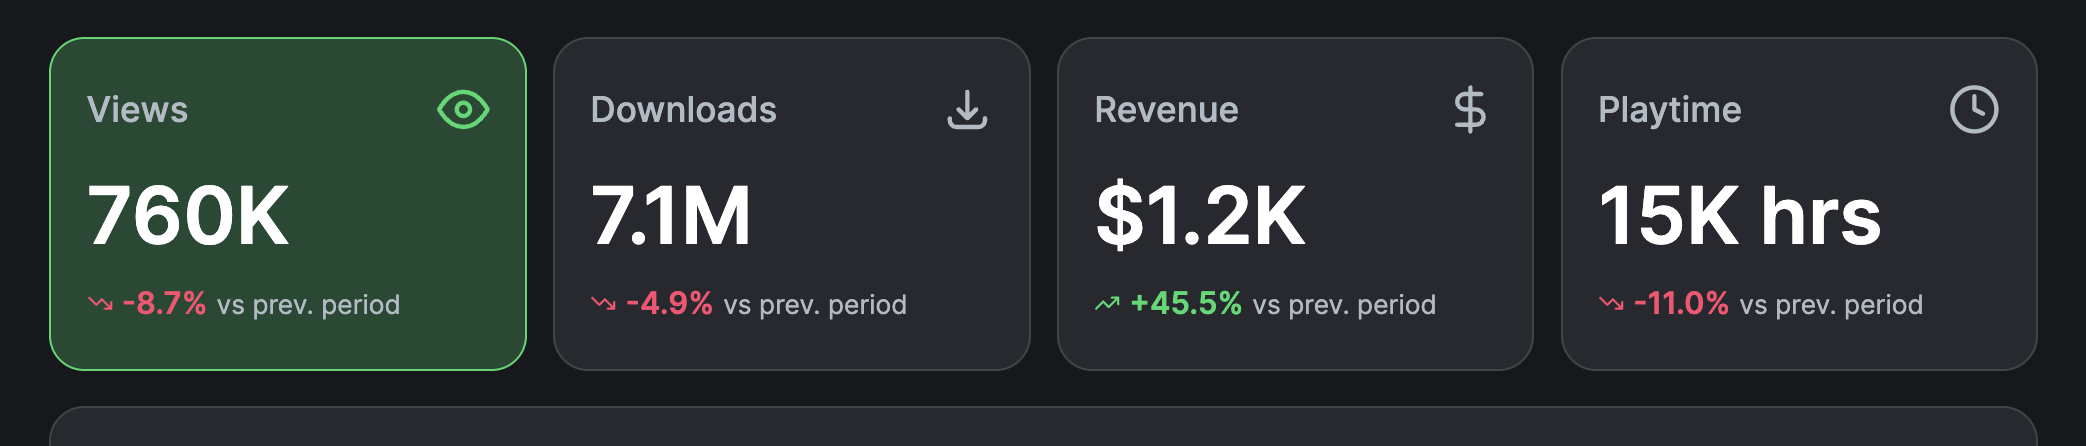
After selecting your query parameters, all of the data below updates automatically. At the top is an overview with four metric cards showing total views, downloads, revenue, and playtime. Playtime is a new metric that tracks hours played by users in Modrinth App.
You can select any metric card to explore that data further on the graph below.
Graph visualization
The graph got a fresh coat of paint too. There are now three different views: line, area, and bar. Depending on your query and selected graph view, additional options may be available for things like comparing against the previous period or showing values as a ratio instead of a raw amount.
The parameters shown on the graph are controlled through the table card below by checking rows. By default, the graph will pre-select up to the first eight parameters based on the current table sorting. You can also hide parameters directly from the graph by clicking them in the legend.
Event markers
Another new addition to the graphs are events. Event markers are designed to provide context for unusual trends on the graph. There are two types of events:
- Project Events: Notable changes related to your project, such as status changes or version releases
- Modrinth Events: Things that happened on Modrinth that may affect analytics, such as revenue being overreported or analytics outages
Table visualization
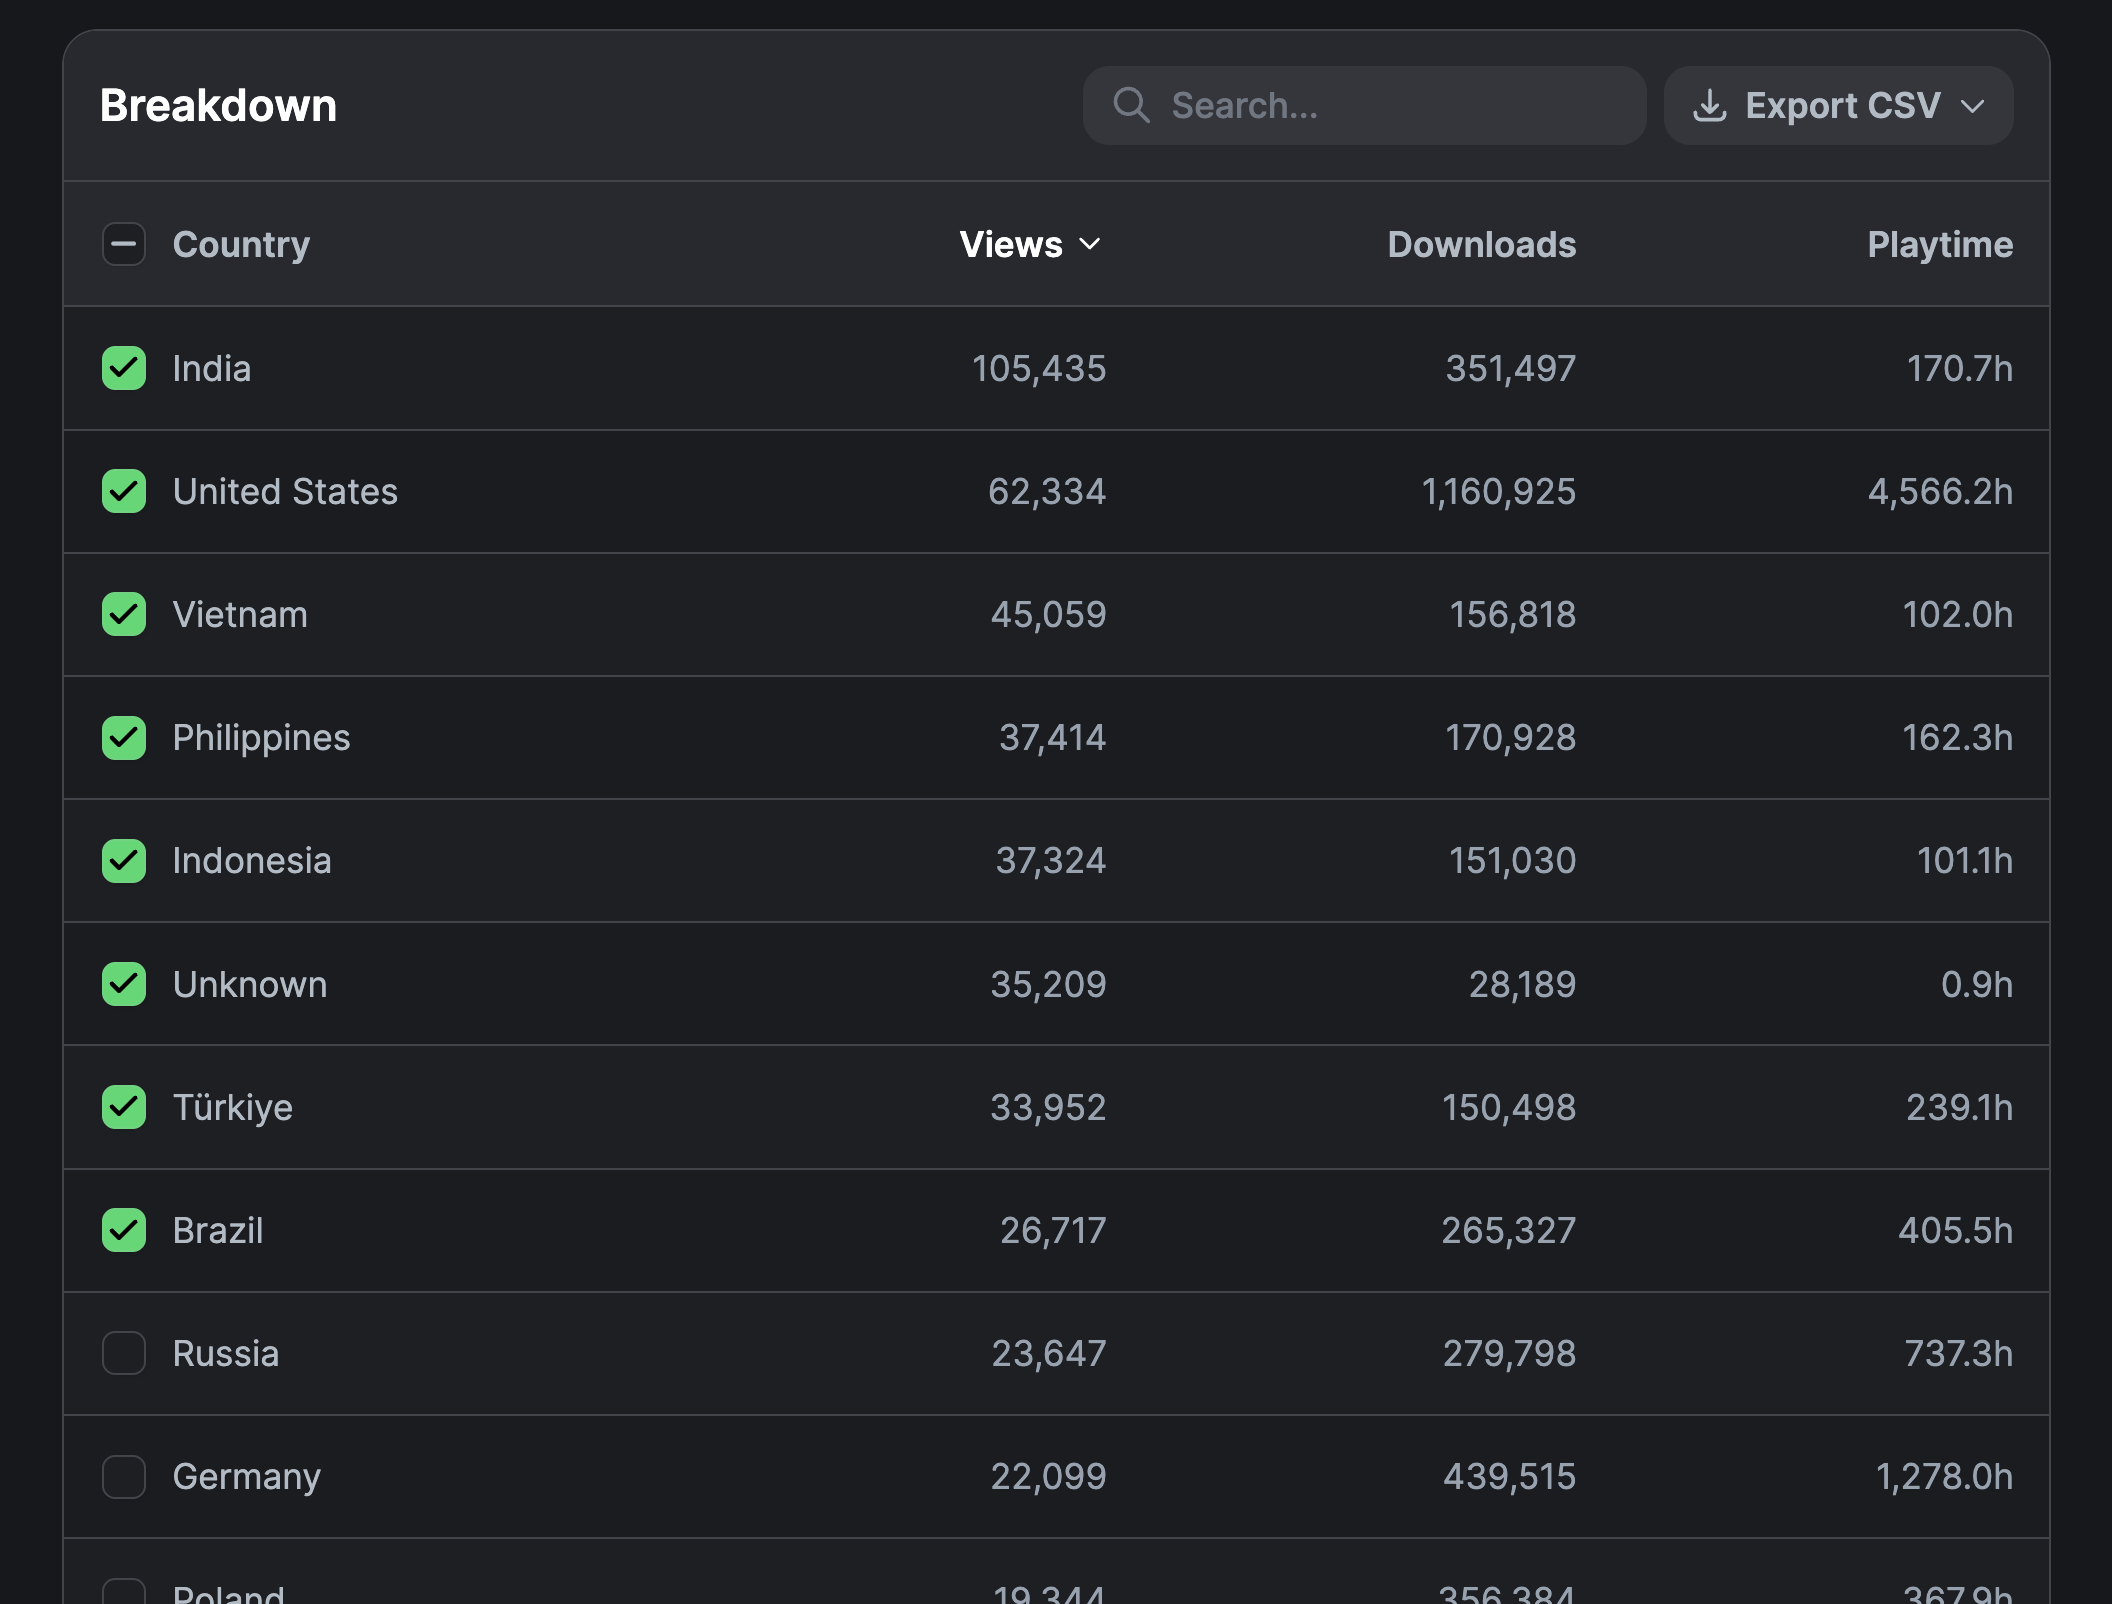
We’ve also added a new table view at the bottom that displays the full results for your query. The table makes comparing views, downloads, revenue, and playtime much easier.
You can also export the table as a CSV to manipulate the data in other tools, with options to include the selected interval.
Contributing analytics data
Some of this data is only available due to support from the launcher or installer downloading the content. If you develop a website, app, or utility that uses the Modrinth CDN to download content, you can also send analytics data back to creators. When sending requests to cdn.modrinth.com, include the modrinth-download-meta header:
{
	"reason": "standalone" | "dependency" | "modpack" | "update",
	"game_version": "<valid game version tag>",
	"loader": "<valid loader tag>"
}
- Standalone: The file was downloaded directly by the user, such as browsing and installing it manually.
- Dependency: The file was downloaded because it was required by another project. This can be automatic through a launcher or manually through a dependencies section.
- Modpack: The file was downloaded as part of installing a modpack.
- Update: The file was downloaded because the user updated something already installed.
If using headers isn’t possible, or query parameters work better for your setup, you can also use mr_-prefixed query params instead like so:
https://cdn.modrinth.com/...?mr_download_reason=standalone&mr_game_version=1.20.1&mr_loader=fabric
—
We hope you’re as excited about this as we are! We're quite proud of this one. If you have any feedback, please let us know in the thread in our Discord server!