
Compatibility
Minecraft: Java Edition
Platforms
Supported environments


Links
Creators

Details
Licensed LGPL-3.0-or-later
Published 6 months ago
Updated 5 days ago
OpenTelemetry can be used to report various monitoring data (including metrics, logs and traces) and is a de-facto industry standard.
This mod provides additional instrumentation for the OpenTelemetry JavaAgent so that various game metrics can be reported. The overall functionality is similar to fabric-exporter.
Instrumented/Reported metrics
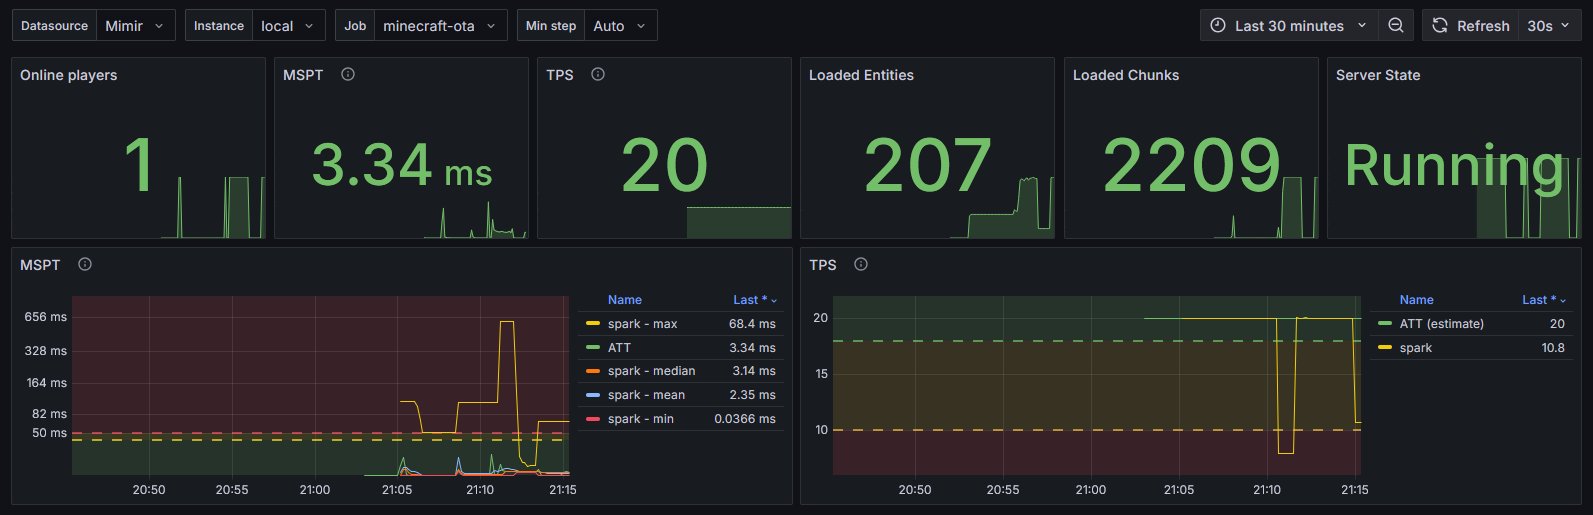
- MSPT/TPS
- Loaded chunks
- Server state
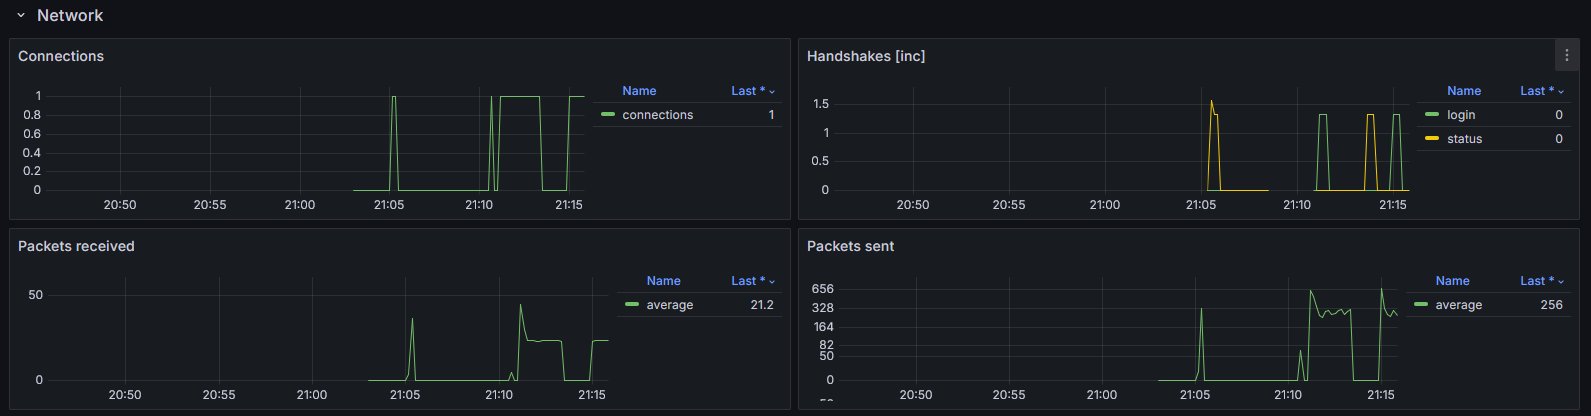
- Networking
- connections
- handshakes
- packets sent/received
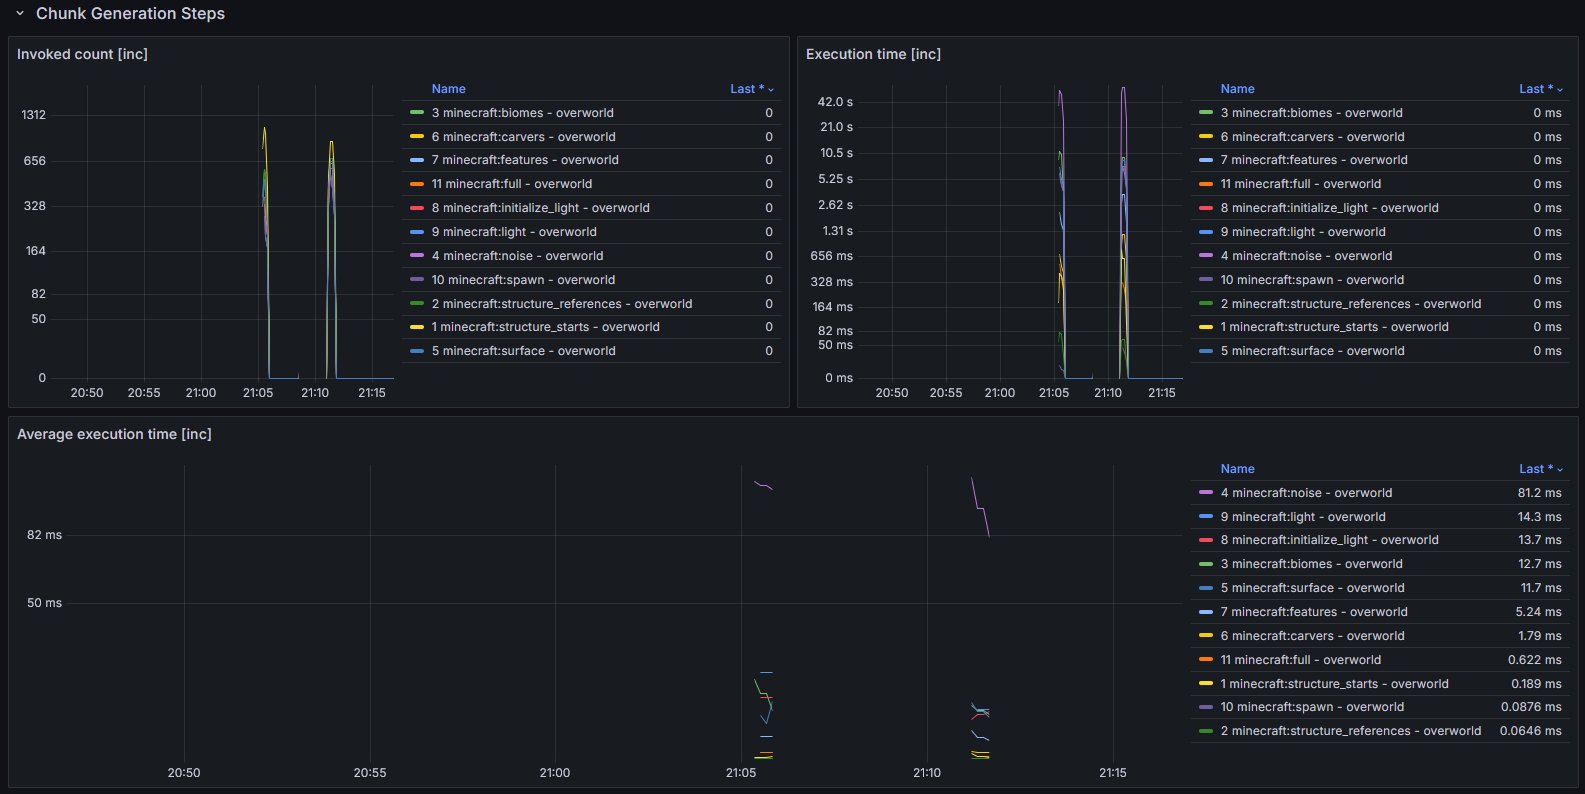
- Chunk generation
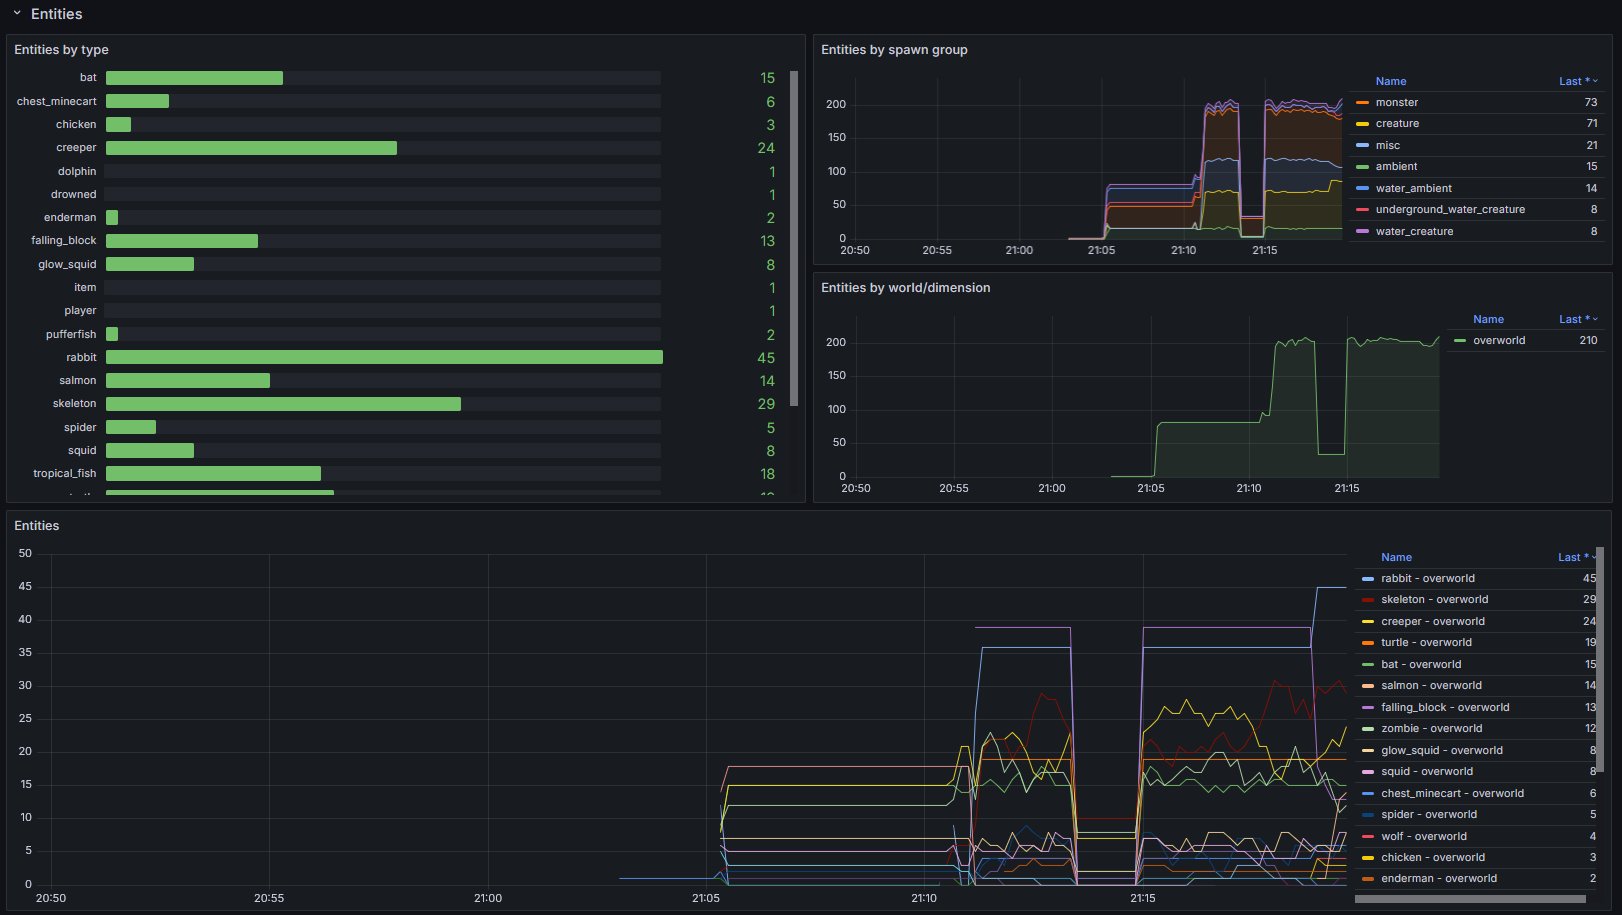
- Entities
- grouped by type, spawn ground and world/dimension
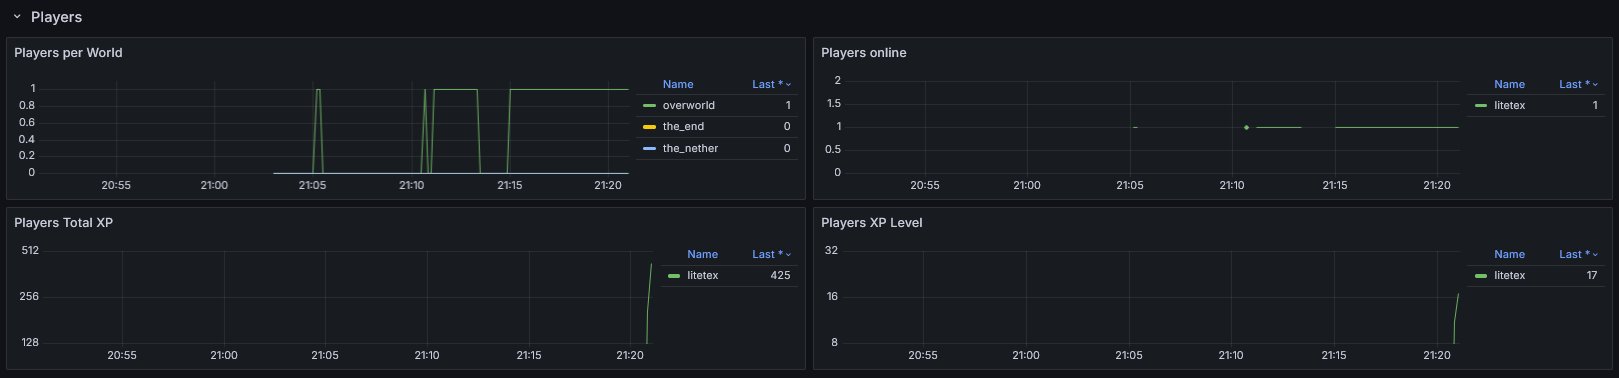
- Players
- by world
- online
- total xp (score)
- xp level
- Runtime
- game version
- Fabric version
- Optional data from spark
Setup
- Make sure you have an endpoint where OpenTelemetry data can be ingested.
This could be a OpenTelemetry Collector hosted by you or by someone else (e.g. in the Grafana Cloud). - Setup the OpenTelemetry Java Agent so that it sends data to your ingestion service.
- Add the OpenTelemetry Agent Helper Extension for Fabric.
- This is required so that the OpenTelemetry Agent is correctly detecting and utilizing the mod.
- Simply add and (optionally) configure this mod. It should work out of the box.
- Import the provided dashboard into Grafana
- From Grafana Dashboards
- From the local demo in the repo
Diagram showcasing how the overall infrastructure can look

You may also have a look at the corresponding development setup as it contains an locally running deployment of the full infrastructure.
Dashboard look
Example integrations
- For
itzg/minecraft-serversee here
Configuration
The default configuration of the mod should usually work out of the box.
If you wish to customize it, open config/oie.json and tune the corresponding values.
Further documentation can be found directly inside the corresponding Java Code.